Recall that the term 's' represents the following: $$ s = j\omega $$ A zero at the origin is a value of 's' that causes the transfer function H(s) to equal zero. A pole at the origin is a value of 's' that causes the transfer function H(s) to approach infinity
Zeros at the origin:
A transfer function with a single "zero at the origin" has the following form: $$ j\omega $$ or: $$ s \qquad,where\;s=j\omega $$ The magnitude and phase of a zero at the origin are defined as: $$ Magnitude = H_{dB} = 20\log_{10}\omega $$ $$ phase = \phi = constant \; 90^{\circ} $$ The Bode plots for a zero at the origin resemble the following:
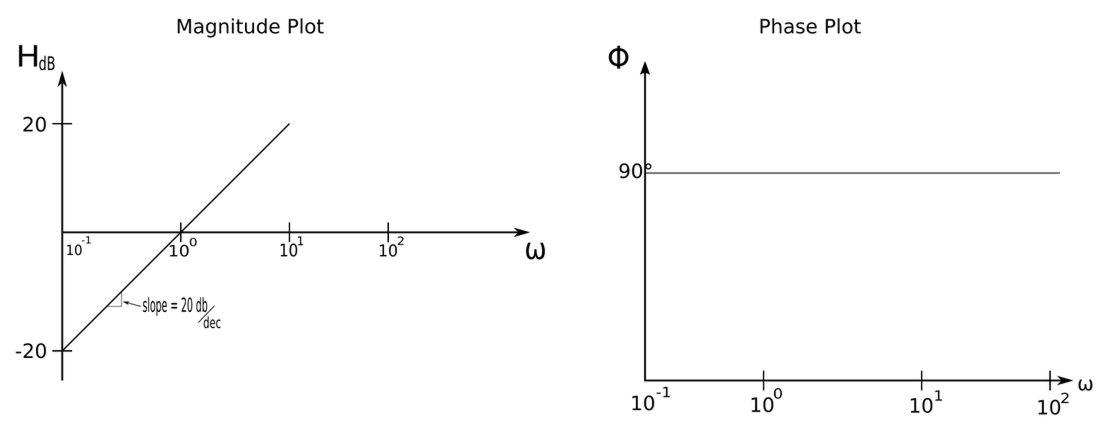
Notice that the slope of the magnitude plot is +20 decibels per decade.
- decade = an interval between two frequencies with a ratio of 10.
This means that the magnitude changes by 20 whenever the frequency changes tenfold (one decade).
Poles at the origin:
A "pole at the origin" has the following form: $$ \frac{1}{j\omega} $$ or: $$ \frac{1}{s} $$ By using the properties of logarithms, a pole at the origin can be expressed as: $$ pole \; at \; origin = \frac{1}{zero \; at \; origin} $$ The magnitude and phase plots for a pole at the origin are similar to those for a zero at the origin but reflected about the horizontal axis:
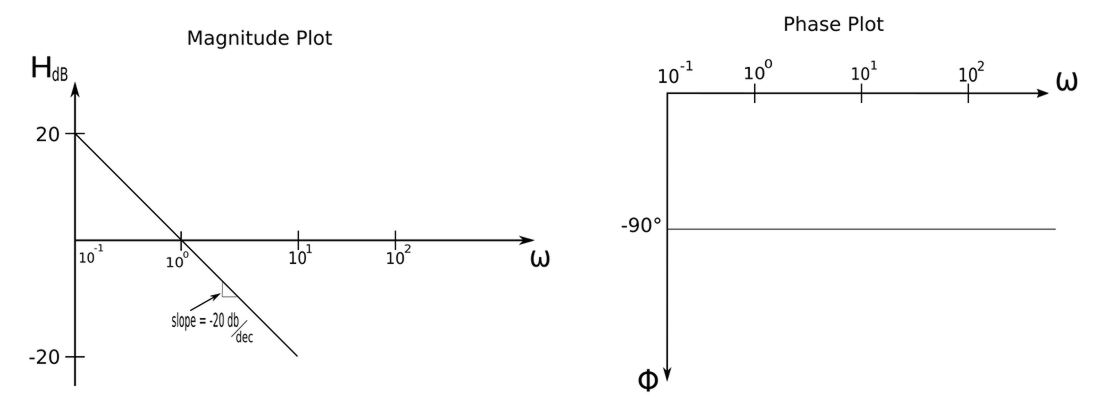
For a pole at the origin, notice how the slope is now -20 decibels per decade and the phase is a constant -90 degrees.
In the next section we will examine Bode Plots of zeros and poles not at the origin.
Continue on to Bode Plots and zeros/poles not at the origin...