Real Zeros and Poles (not at the origin) are sometimes called Simple poles/zeros. Recall that zeros and poles are values of "s" that cause the transfer function to go to zero or infinity. In the case of simple zeros/poles, "s" is a real number.
Simple Zero
A simple zero has the following form: $$ 1+\frac{j\omega}{\omega_0} $$ or: $$ 1+\frac{s}{\omega_0} \qquad,where\;s=j\omega $$ Where: $$ \omega_0 = corner \; frequency $$ Magnitude and phase for the SimpleZero are defined as follows: $$ magnitude = H_{dB} = 20\log_{10}|1+\frac{j\omega}{\omega_0}| $$ $$ \qquad\qquad\;\;\; = 20\log_{10}\sqrt{1+\Big(\frac{\omega}{\omega_0}\Big)^2} $$ $$ phase = \phi = \tan^{-1}\Big( \frac{\omega}{\omega_0} \Big) $$ The magnitude and phase plots appear as follows:
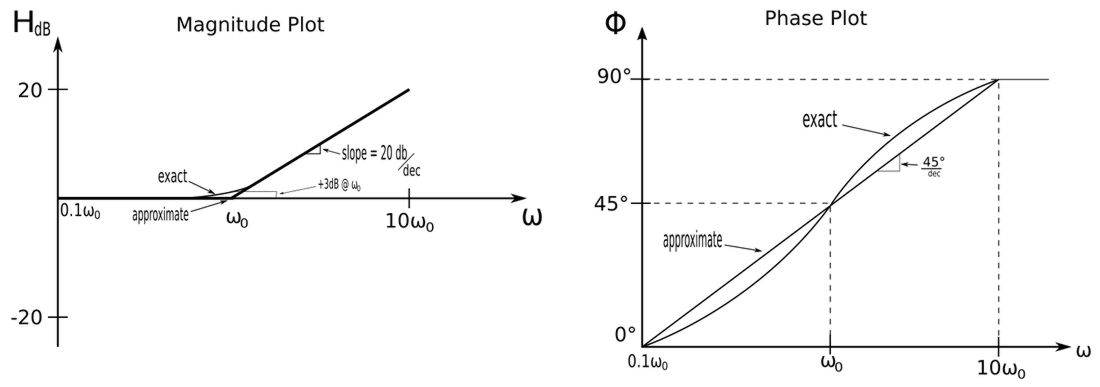
Know that when we sketch these Bode Plots, they are straight-line approximations that will differ somewhat from the actual smooth-curve plots that can be obtained via computer software. For the magnitude plot of a simple zero, there is a +3dB difference at the corner frequency between the straight-line approximation and actual plot. The slope of the straight-line magnitude plot is +20 dB/decade while the slope of the straight-line phase plot is 45 degrees/decade.
Simple Pole
A simple pole has the following form: $$ \frac{1}{1+\frac{j\omega}{\omega_0}} $$ or: $$ \frac{1}{1+\frac{s}{\omega_0}} $$ Notice that a simple pole is essentially the following: $$ simple\;pole = \frac{1}{simple\;zero} $$ The Bode Plots of the simple pole are the plots of the simple zero reflected about the horizontal axis:
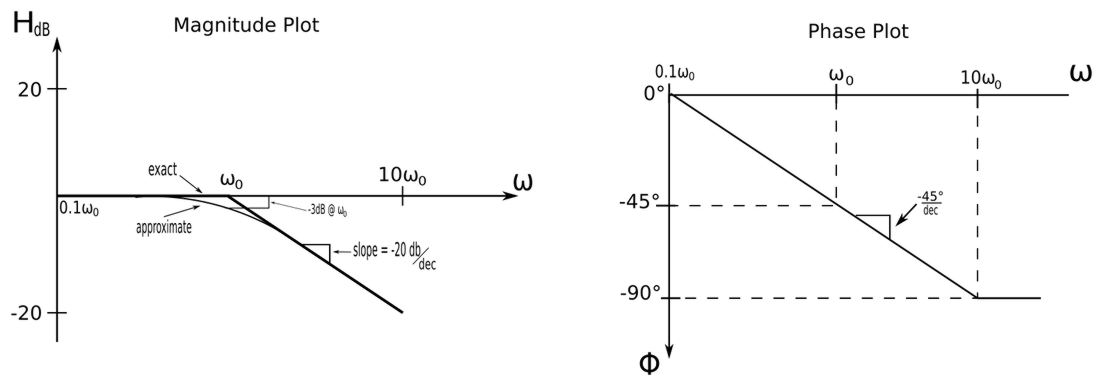
For the slope of the magnitude plot, notice that there is a -3dB difference between the exact and approximate plots at the corner frequency.
In the next section we will examine Bode Plots of Quadratic zeros and poles not at the origin.
Continue on to Bode Plots and Quadratic zeros/poles...