The fastest and easiest way to construct an accurate Bode plot is via software. While there are multiple software packages that can accomplish this task, we will specifically look at Maple and GNU Octave. We will use the same transfer function as a means of demonstrating the construction of Bode plots with both programs.
Constructing Bode Plots with Maple
Maple is a well known proprietary mathematics software package available for purchase. It is compatible with Linux, Mac and Windows. We will proceed to construct the Bode plots for the following transfer function: $$ H(s) = \frac{1.6}{s(s^2+s+16)} $$
Enter the following commands:
- with(DynamicSystems);
- sys := TransferFunction(1.6/(s*(s^2+s+16)));
- BodePlot(sys, range = .1 .. 100);
By hitting "Enter" after each command you end up with the following output:
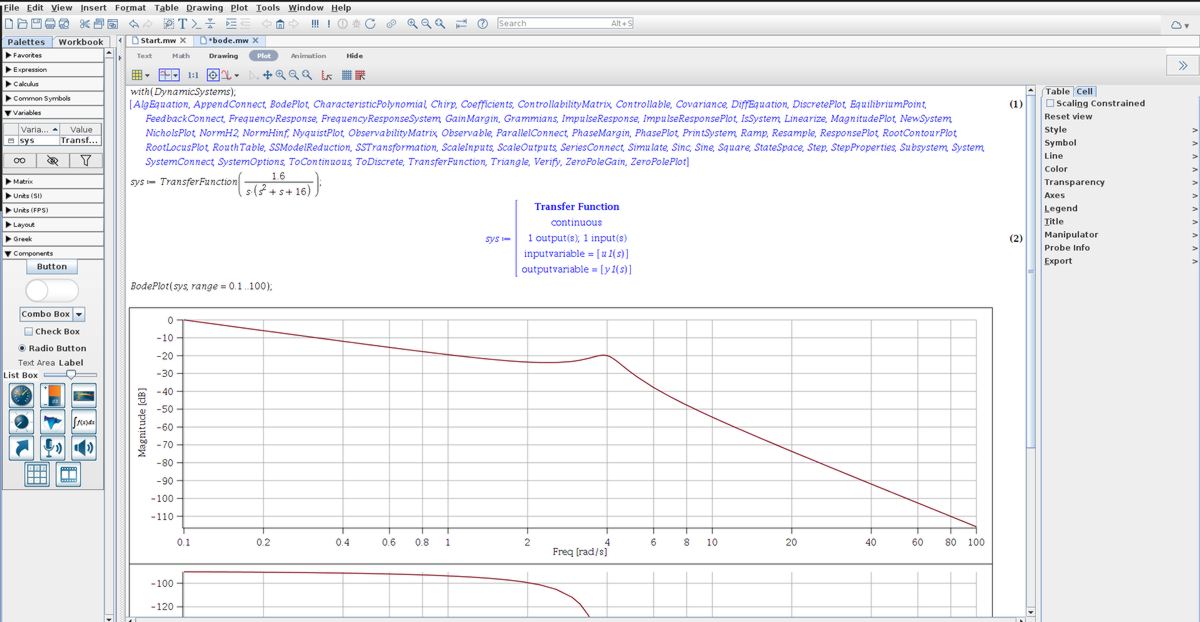
Scrolling down slightly displays the magnitude and phase plots:
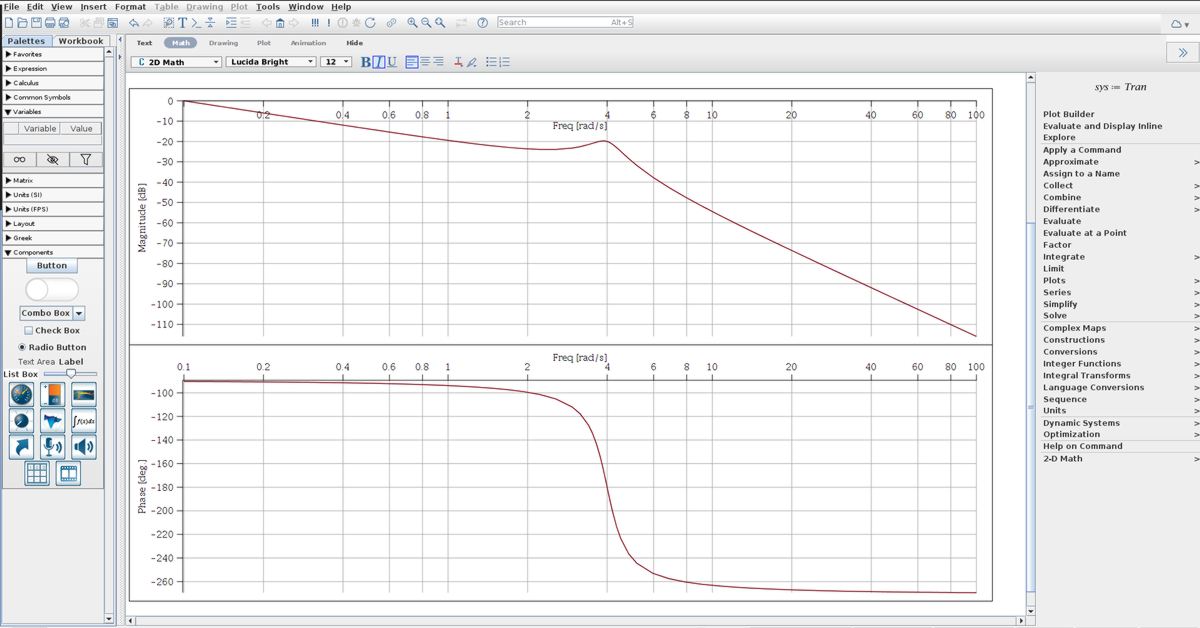
Many different formatting arguments can be passed to the "BodePlot" function in terms of line styles, colors, as well as the number of points to be plotted. The range of values on the frequency axis can be adjusted as well. To get accurate data along the curve simply click on the magnitude or phase plot, head over to the vertical menu on the right side of the screen. Under the "Cell" tab select "Probe Info" then check the box for "nearest point on line". Now when you mouse over the plots you will see updated values for magnitude and frequency as you move the pointer along the curve.
Constructing Bode Plots with GNU Octave
GNU Octave is a free and open source Science and Mathematics programming language the is nearly a drop-in replacement for MATLAB in terms of syntax (though you may run into some minor differences depending on the application). It is also available for Linux, Mac and Windows.
Control Package installation
Assuming you have Octave installed on your machine, you will need to download and install the "control" package. It can be found at the following official Octave package repository link (Octave Forge): https://octave.sourceforge.io/control/index.html At the time of writing this, the most recent version was 3.2.0. For Linux, the following dependency needs to be installed on your machine:
- liboctave-dev
Once you have downloaded the control package, start up Octave and at the command prompt type:
- pkg install download_location/control-3.2.0.tar.gz
- ...where "download_location" is the path to wherever you have saved the compressed archive file.
It may take a minute or two for installation to complete and no status updates are given during this time. If everything installs successfully, you will see a the double arrow command prompt return to the screen. If a problem occurs then error messages will be displayed. Once the package is installed proceed to load it by typing:
- pkg load control
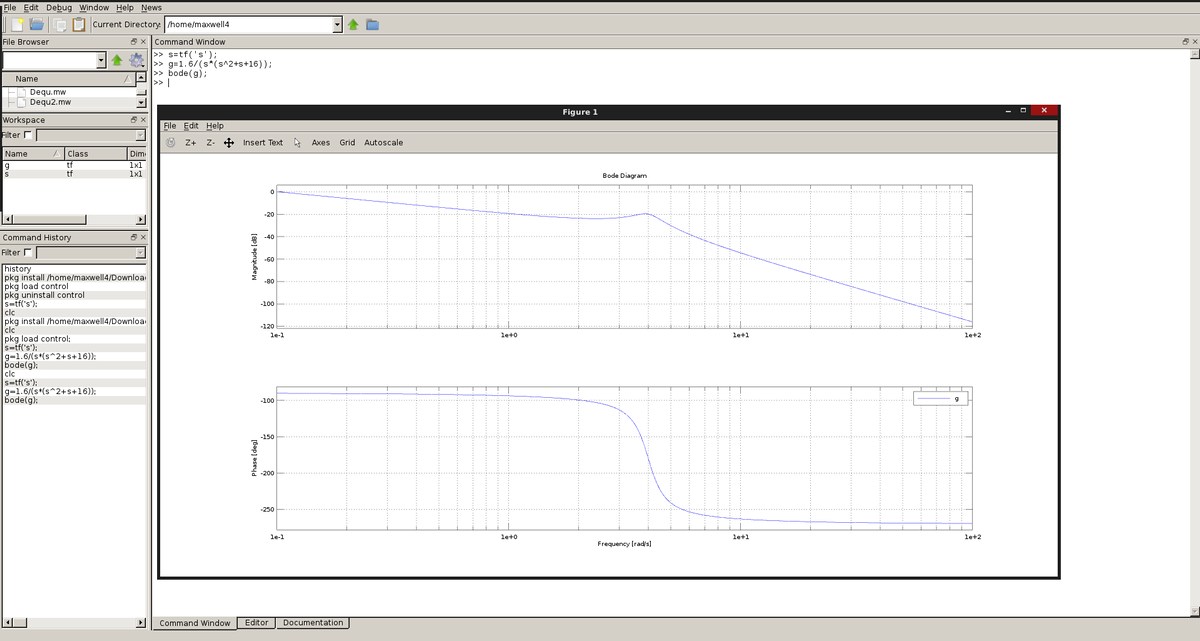
If you exit your Octave session and relaunch the program, you will need to reload the "control" package if you intend on using it (to work with transfer functions and Bode plots for example). Simply type "pkg load control" to do this. You do not need to go through the whole installation process again. We will now proceed to construct Bode plots for the same transfer function: $$ H(s) = \frac{1.6}{s(s^2+s+16)} $$ Type the following commands (pressing "Enter" after each one):
- s=tf('s');
- g=1.6/(s*(s^2+s+16));
- bode(g);
After the last command, a window pops up with the Bode Plots (shown below):
Summary:
Maple and GNU Octave are both valuable tools in terms of constructing accurate Bode Plots. They are also excellent teaching aids when you are learning to construct the plots by hand and want to check the accuracy of your approximations.